Share this
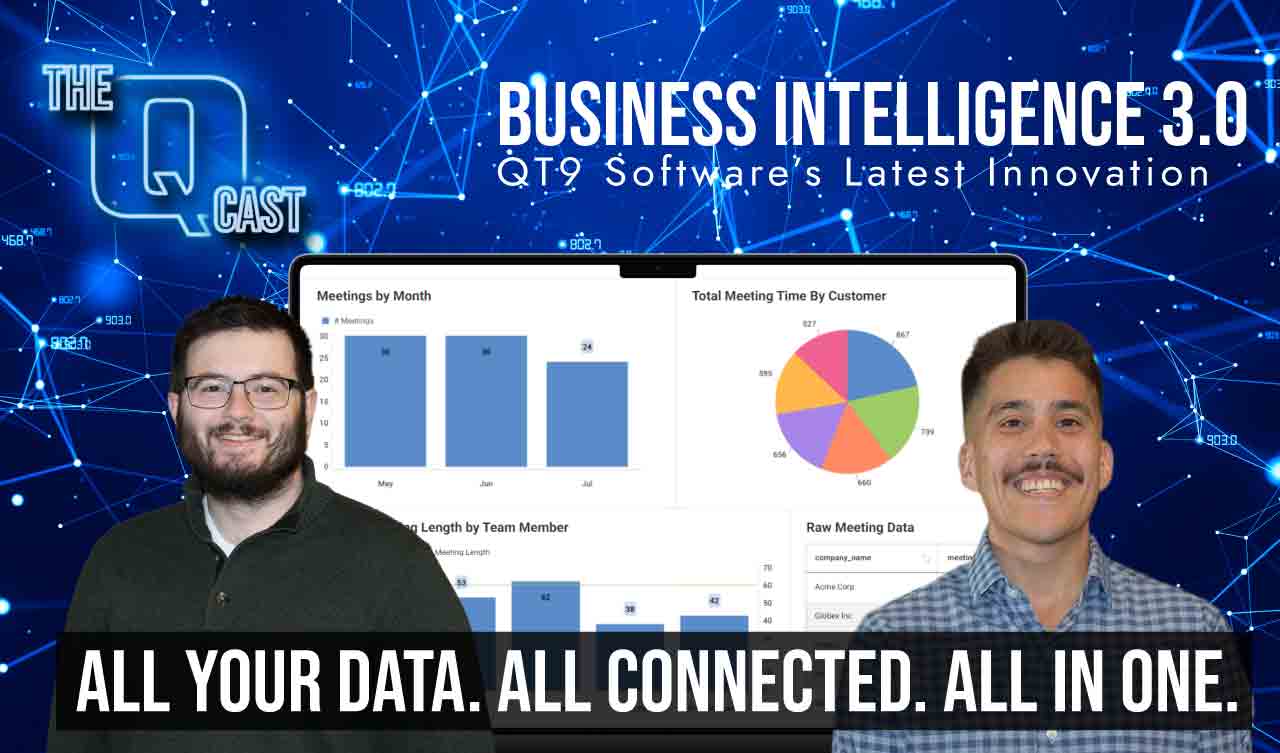
Episode 4: Data to Decisions with QT9 BI 3.0, ERP & QMS
by Christian Reyes on Nov 18, 2025 9:09:02 AM
Watch Episode 4 Below
Episode 4: In this episode of QT9 Q-Cast, host Christian Reyes sits down with data analyst Riley Wise to reveal everything you need to know about the new version of the QT9 Business Intelligence (BI) Tool, launching December 2025. This major update unites QT9 QMS, QT9 ERP, and external data sources (like Excel, REST APIs, CRMs, and MySQL databases) into a single, unified platform—giving manufacturers a powerful way to turn their data into actionable insights.
Wise walks us through how QT9 BI 3.0 enables teams to build custom dashboards, KPIs, reports, and visualizations without traditional manual exports, VLOOKUPs, or spreadsheet maintenance. Customers can now analyze supplier data, inventory aging, training delinquencies, nonconformances, change controls, jobs, purchasing data, and more all in one interface.
This update also includes a completely redesigned Query Builder, now enabling read-only SQL queries directly against QT9 data for deeper, more granular analytics.
Whether you’re a quality leader, plant manager, operations director, or data-driven manufacturer, this episode shows why the new QT9 BI tool is becoming the all-in-one hub for QMS + ERP analytics, data unification, and streamlined reporting.
What You’ll Learn in This Episode
- What the QT9 Business Intelligence tool is and how customers use it today
• What’s new in QT9 BI 3.0 (launching December 2025)
• How QT9 BI unifies QMS and ERP data for combined dashboards & reports
• Real examples of out-of-the-box dashboards, including:
— Inventory aging & expired inventory
— Change management dashboards
— Training delinquencies by department
• How customers can build custom dashboards and KPIs without coding
• How flat-file Excel uploads, MySQL connections, and REST APIs expand analytics
• How data refresh schedules, governance, and permissions work
• The new view-only portal for non-licensed users
• How the Query Builder enables advanced SQL-driven analytics
All insights and examples are taken directly from this episode’s conversation between Christian and Riley, based on real customer use cases and system capabilities.
Key Features Discussed
- Unified QMS + ERP data source for combined insights
- Pre-built dashboards &and reports included with the BI tool
- Editable dashboard templates customers can copy &and customize
- Custom dashboards from scratch using drag-and-drop fields
- Automated data refresh schedules (hourly, daily, or always-up-to-date)
- Live-data reports generated at run-time
- Excel/CSV ingestion integration for one-off or external data
- REST API and MySQL integrations for CRM, meeting platforms, or third-party systems
- View-only portal for large teams needing read-only access
- SQL Query Builder for direct database queries
Why This Episode Matters
Manufacturers today need quick access to clean, reliable, centralized data. QT9 BI 3.0 eliminates time-consuming manual exports and brings quality, production, supply chain, and training metrics together in one place. With this release, customers can finally create one source of truth across QMS, ERP, and external systems—right inside the QT9 ecosystem.
Learn More & Request a Demo
QT9 BI 3.0 launches December 2025.
To request a demo or get pricing and licensing details, visit the QT9 BI landing page [https://qt9software.com/business-intelligence-tool] or contact your Customer Success Representative.
Episode Transcript
Christian (00:00)
Imagine logging into your management system and in one view seeing supplier defects from your quality management, on-time delivery metrics from your ERP, as well as
KPIs from one-off spreadsheets, all in one spot, ready to view and share for a daily stand-up. Today on the QT9 QCast, we're unveiling a new way to turn your data into decisions. Data analyst Riley Wise joins us on the show to talk about the new version of Qt9 Business Intelligence, coming this December. Riley, thanks for joining us today. Thanks for having me on. Absolutely. This is the...
Qt9 QCast is the show for quality and operations leaders building better systems and I'm your host for today. Again, we're gonna be talking about the new version of the Qt9 Business Intelligence Tool coming out this December. This brings together custom reports, dashboards, and analytics across every Qt9 product, and even external data sources. Our guest is the person leading the product, Riley. Riley, again, welcome to the show. Thanks so much. Before we dive in, a quick note.
Features and timing of the new release are still up in the air and are evolving. So Target Launch is December 2025, but for the latest details and demos, reach out to your Qt9 rep or click the link in the show notes. So to get started, what is the Business Intelligence Tool? The Business Intelligence Tool is a great way for customers to build analytics from their data, primarily from either their QMS or ERP tool. It allows them to...
build their own dashboards, whether it's charts or figures or creating KPIs, and really lets them kind of dive deep into their tools and bring out kind of those relevant data points that they need to manage their teams. the kind of big exciting thing with it now is we have an update, as you mentioned, coming out this December.
that's bringing even more capabilities to that tool.
So first,
they can bring in metrics both from QMS and ERP into the same data source. So it's no longer two separate locations, two different sites. So for any of our customers that have both QMS and ERP, there's a real opportunity for them to bring in those metrics together when the use case is right to do that.
But to go even further, beyond just bringing in...
QMS and ERP data onto a single site, we're expanding the data that's available to our customers as well. So beyond Qt9 data, they can also upload a flat data in the form of an Excel and bring in external sources. They're also going to be able to connect through a RESTful API connection, any other API endpoints. So if they wanted to go to CRM data from HubSpot or to gather...
meeting data that they've recorded in a tool such as Fathom. They could bring that data in and do reporting on that as well. OK. That's a very powerful tool. There's a lot of potential synergy there, obviously, with the tie-ins that we have with QMS and ERP in terms of the interface, being able to create non-conformances from within the ERP, pulling documents down to a bill of materials. We've got all the interface tied in, but this is kind of taking that next step to where you can marry.
all the data, all the good data that you're tracking throughout the system. Exactly. can bring them together. That's actually quite powerful.
So in terms of new users, what is the fastest path from raw data to a useful dashboard? Sure. So there's a couple directions that we can kind of take a customer with that. So anytime a customer purchases the tool, the ERP and QMS is already going to be connected to that tool. So along with that connection, we have pre-built analytics already in the tool for them. So no extra steps from them. We have pre-built dashboards and pre-built reports that can
Day one, just go into those and use those dashboards and reports right away. So you don't even have to create a connection string pointing at this database, that database. Exactly. It's just as soon as you have it, it's ready to go. That's exactly it. OK. The other thing that we do as well is when we onboard a customer, we also set up training times with the customer. That way we can both train them on the tool.
and hopefully get them started with their first couple of dashboards as well to really kind of bridge them into the tool. Absolutely, absolutely. And it reflects what we kind of do on the training implementation on the QMS side, I believe, in terms of support. We don't want to just hand you the tool and say good luck. Exactly. a little bit more of a white glove service than that. We're not going to leave you hanging. But it's very cool that right out of the box the tool already has some functionality and some data roll up.
That's a good foundation on what the tool is. The existing tool, the new version coming out brings together the QMS and the ERP reports.
Why is it amazing to be able to report on your ERP and your QMS data in one tool? The real power here of bringing both of those into the same tool is now a customer can compare their data from one to the other. instead of kind of creating a silo dashboard just on their QMS audits or QMS, know, NCP records or...
creating a siloed report or dashboard on the ERP side for jobs, for instance, now you can combine, create combined views, right? So for example, if you wanted to create a dashboard to compare your supplier NCP data and compare that with your purchasing data from your ERP side, this capability is now available to customers in the BI tool. Gotcha, gotcha. So it's really taking unification.
just to the next level. I that's really the Qt9 perspective from both sides of the product is trying to make it one spot, not islands of software, not silos, but one spot, one system where you can do everything, all of your processes. obviously, like you said, to be able to take that to the next level and run some sort of analytics, pull out meaningful data on there, you need to have those dashboards, those reports. And so this tool gives that reporting layer on both products that brings it all together.
Definitely. Cool. Very cool.
Okay, what day-to-day work goes away for customers that have the business intelligence tool? Talking exports, VLOOKUPs, manual reconciliations? Certainly. So a lot of customers who don't already have the BI tool, a lot of them when they're trying to build out their analytics for a particular department, they need to go to some grid that's either in QMS or ERP, filter it down, you know, exactly how they need the data, export that grid out to Excel, and then kind of...
build out all of their kind of visualizations and summaries in Excel, which can be a multi-step process there. And it can be very tedious, especially for a customer. Let's say they have some type of reporting that they need to do on a weekly basis, a monthly basis. Then it turns into not just a one-time haul, but in terms of regular time that they need to spend on this every single month or every single quarter. Really, the power that the...
the BI tool is going to enable customers to have, is to streamline that. No longer do you need to export data out of the QMS and do this whole manual process of setting up these reports or these Excel files or any other type of external reporting every month or every quarter. You can set up the dashboard to contain all of the KPIs and metrics that you need in a one time, filtered exactly how you need it, and then filter that dashboard.
by whichever quarter that you're doing your reporting or by whatever other type of metric that you're trying to look for. It really streamlines the entire process. It sounds like it. It sounds like it's just having the one interface alone to be able to go to and pull it up. And it sounds like once you build it out the one time, you don't have to build it out again. Exactly. And another kind of really powerful thing with it is you can set up the filtering to be exactly how you need it. So if a customer wants to kind of
build a dashboard and then see it for a particular department, a particular site, particular team. They could set that up and then reuse the same dashboard, but filter to the exact specifications that they need for each of those fields. That's awesome. That's awesome. So getting a little bit into what comes with the system. Now, obviously, we'll talk about how customers can build their own dashboards and completely custom build them out. But in terms of what comes with the tool.
with a customer that purchases the business intelligence tool. What are some examples of QMS dashboards or analytics that comes with the tool out of the box? Sure, that's something that we can actually share right now. awesome. I can show you a couple examples for that. So as we were kind of describing earlier, there's dashboards and reports, and those are the two big areas that we had previously. And I think that's where I'm going to highlight
in this kind of discussion. With dashboards, obviously customers can create their own analytics, but we also have the defaults, the kind of system defaults that are in there already as you were describing. So for example, on the ERP side, we have a dashboard called Aging and Expired Inventory. So a customer that's trying to do a little bit of inventory management to see how old is their current inventory in stock.
what's expired, how can we get those kind of filter looks to kind of better purge bad inventory, that'd be a good way to do it. Another one, if we want to look on the QMS side, for instance, we have a dashboard called Change Management,
where a customer can look at their modules on the QMS side related to change management, for example, or change controls, and see a breakdown of the records. For example, they can see which ones are coming due, which approvers are outstanding right now for the records which have been sent in for approval, and which records are currently in what status. And it gives them the kind of high-level operational view of their change management in QMS.
That's awesome. So these, don't have to touch anything. This just comes with the tool out of the box, ready to go. And this is all out of the box. Yes. That's awesome. That's awesome. I can see how that'd be useful to customers in and of itself, much less having, you know, writing their own custom dashboards above and beyond that. And like you said earlier, once we deliver the tool, it's just ready to go. They don't even have to like point it at a database. They log in and boom, they've got these nice reports that are ready to run. It's all available right to them. That is very cool.
That is very cool. you said not only there's for QMS, but you'd mentioned like the inventory report. There's some reports, dashboards for the ERP that come out of the box. ERP. And this, you know, as I was describing earlier, we have canned dashboards, but obviously we also have the canned reports as well. So for instance, you know, a very common use case that we get for customers is they want to see more analytics for their training module, right? What's our training delinquencies, right? That's a very common use case I get. And, you know, in our
BI tool, we can look at all of these different canned reports as I'm kind of scrolling through here. These are all going with the tool. These are all built in with the tool. If I grab, for instance,
We'll edit this out as I scroll through here. For instance, if we look at our training delinquencies by department, on the right-hand side, we can fill in a couple of parameters for this report. So for a multi-site, this would be very relevant to them.
let's go ahead and let this generate. It's going to generate this report. And in this case, you can see that we're building out this kind of training delinquencies by department. So for each department, we're getting a list of the employees that have delinquent trainings in those. How delinquent are they? When did the training occur? And it really kind of provides a really great look for customers to kind of look in that and see where they need to kind of poke someone to get their training done and really going to help them.
kind of manage their training within QMS. For sure, for sure. Definitely a lot easier to stay on top of that. Like you said, for a larger organization where you could have thousands of employees moving training records, can be a lot to wrap your arms around.
So with these dashboards that come out of the box, can customers make minor modifications to them?
or are they kind of stuck with our dashboards that come out of the box? Yeah, so that's a good point to bring up. So any of the pre-built dashboards that we have in our tool, so we're looking at the inventory management for instance, or the change management that we talking about earlier. Any of those pre-built dashboards, a customer can create their own copy of any of them and modify them however they wish. So whether they want to add a new KPI to those dashboards, they could do that.
Or let's say they see a dashboard and they want to see how something was built in that dashboard. They could create a copy, open it up in edit mode, and see exactly how we built that dashboard. That's really what we tried to accomplish with those dashboards. Some of them are very operational minded. We believe that a customer can just take these and use them right out of the box. Some of them are really to help demonstrate different features of the tool to allow customers to see that can be done. We can create a trend chart. We can create a pie chart with a drill down.
We create all these different dashboards, hopefully provide plenty of examples for customers to use and create their own dashboards from them. That's great. mean, it's obviously awesome when you've got everything under the sun custom at your fingertips. But a lot of the times, that can be overwhelming. You don't know what you don't know. You don't know the reports that you want. You just know you want a custom report. So having some examples like that where even if they see a pie chart and nonconformances, but they want to, I want to apply that in our corrective actions dashboard.
it gives them some examples of what the tool can do. then, like you said, they can then apply those to different dashboards and kind of make them their own, tweak them to what they really want to see. That's exactly correct, yes. Now, do they also have that on the reporting side? So reports are not editable by our customers, but we provide this library to our customers, and we can create customer reports as well. But that is done pretty much by the Qt9 team.
If a customer wants to pursue that direction, they can just reach out to the CSR and that can be a discussion that they have. For sure. So the customer reports, it's an option, but it's just got to be done by the Qt9 team. It's that extra level of programming or development, what have you, whereas the dashboards, that's entirely up to them. They have the ability to edit those within the interface. Yes.
So you actually sit down and do the training with new business intelligence tool customers, is that correct? We do, yes. When a customer first purchases the BI tool, they get two training sessions in which we'll train them up on how to build dashboards or how to work with the other features of the tool. They can either gear those trainings to training itself, or we can help them build dashboards to kind of jumpstart them within the tool.
Okay, okay. And can you speak at all to what customers have been asking for in those training sessions? Sure. Or is it, you know, kind of the rinse, repeat, same thing every time? Sure, well we get a lot of kind of common requests because I think there's a lot of overlapping kind of use cases that a lot of customers need with the BI tool. you know, whether it's on the QMS side, what are my open records, what's coming due, right? Can we sort this by a due date?
can I filter down for a particular responsible party? Those are some common use cases. I see a lot of customers wanting to report on their training data. Can I pull in our training records and compare that with seeing if a particular employee has completed their training or if they're delinquent? And these are the sorts of dashboards that we've built with our customers on their training calls. And we can really hopefully tailor that call really to the customer's needs.
Sure, sure, absolutely. Like we said, kind going back to the white glove treatment, it's not just here's the tool, here you go, but you actually can sit down with Riley here and talk about not just how the tool works, but what you can use the tool for and how to make that happen. What is the typical flow in terms of working within the tool? Are people normally starting from scratch?
Or oftentimes, is it using one of our baseline dashboards and then adding fields, taking fields away? What do you see there? I see a lot of customers building their own dashboards. So between our training and the default dashboards that we have, we provide a lot of examples and help onboard a customer into using the tool. And really, that's what we cover in the training. But I see a lot of customers tailoring it to them. Because I think
especially is useful. Every customer has their own use case, right? They have their own reason for needing the tool. They have a particular module in mind, they have a particular team in mind, they have a particular process that they want to manage, right? And customers go in and after the training, they can then tailor and build out their own dashboard to fit that need. For sure. Yeah. For sure.
Now let's zoom out a bit to data sources, because that's one of the big things here, right, is the fact that we can bring in the QMS data source. So all of your QMS data, as well as your ERP data, and it brings it into one interface here. What other data sources, if any, can be fed into the tool? Sure. So there's kind of three other big sources of data that customers can now bring in with the new update.
So the first one is an Excel file. So if they have an Excel file formatted just as a kind of a simple table, they can upload that in and utilize that within the dashboards. And again, this is not just a silo. They can combine that with their QMS or ERP data. So they can bring in this Excel to hopefully kind of accelerate those analytics. But they can also bring in any data from a MySQL database.
And they can also connect to any RESTful API endpoint as well. So for example, something like HubSpot or something like Fathom, they have RESTful API endpoints that you can connect to.
So how does refreshing the data work within the application? Is it a manual process for our customers? Can you talk a little bit on that? Sure, it's not manual at all. can actually, when we set up a dashboard, you actually set that refresh rate right when you make it. So you can set it to always, hourly, daily. And once you've set that refresh rate, it's going to handle that for you. No need to manually refresh that data for the dashboards. OK, and you said that's per dashboard. can set that refresh dashboard. That's exactly it. cool. Very cool. Now on the report side, you know, it
it pulls that data whenever you generate the report. So no need to set a refresh rate. Whenever you run the report, you're getting the live data. Boom. It's just snapshot from whenever you run the report. That's a snapshot of the data. Cool. That makes sense. So let's talk a little bit about governance and getting people ready for a rollout in terms of the logistics of the application.
How do people get into the system and how is that constrained? Sure. So the license structure works in the same way that QMS or ERP works. So it's by concurrent license. So if you can buy one or two or three seats, mean, that's by seat. And you can share it with as many people as you want. So if you want 100 users to have access to BI tool, but you only want three seats.
The way it works is only three people can be online at the same time. So just like QMS and ERP, it's a separately licensed tool, but it works in the same way.
Now, is there any other portal, or do you need to use one of those paid licenses if you just want to view a report or have someone look at a dashboard? Sure. So with the BI tool, we also have a separate addendum tool called the view-only portal. OK. And I think that's kind of what you're talking to there. If a customer has 100 people that they want to have access to the site,
But they only need one or two people actually editing dashboards or something like that. And all the other users are just view only. That'd be a good use case for the view only portal. In that tool, a user can see dashboards and reports which have been shared with them, but only as a view only user. if you want to create a dashboard for your team, or if you wanted to create a dashboard to have on a TV somewhere on your production line, there's no need to...
buy another BI license just for that, you can buy a view-only portal license at a lower rate. If a customer has ever worked with the dock portal or something like that where they get a block of users, the view-only portal works in similar way. So at a cheaper rate, it gives a view-only access, and it's good really for teams or, as I said, if they want to put it on a TV or something like that.
the BI tool works in the same way as ERP and QMS, where it has its own set of designations for each user. Now, for any of our customers who already have the BI tool, this is actually going to be another change. No longer are those designations going to be managed on QMS or on ERP. All those designations are actually going be managed within the BI tool itself. But it's going to be the same designations as before. You can have an admin user, an edit user, a view-only user.
and you can kind of configure those how you need for each user of the tool. if you have a user that has view-only access, you can share particular reports or particular dashboards with that user. So if you want one team to see their relevant dashboards.
and another team to see theirs, you can do so. So if you have accounting or some other module that you don't want every user to see, you only want every user to see what's relevant to them, you can configure that with the tool as well. Gotcha.
So when is the tool set to come out? Sure. So the new version of the tool is set to release December 1st. Okay. So it's coming out very soon. Yeah, that's right around the corner. Yep. And so for the new version coming out,
how would they go about
getting more information on the Business Intelligence tool? Sure, I think the best way for them to get more information is to request a demo. There's a couple ways they can do that. We're releasing a new page on our website just for the BI tool that they can access and see that information and request a demo there. Or for any of our current QMS or ERP customers that don't have the BI tool yet, they can reach out to their customer success representative to schedule a demo and see that tool presented to them. For sure.
For sure, reach out to customer success. Sounds like the way to go. And we'll put a link to that landing page for the BI tool. We'll put a link to that in the show notes so people can click through.
So above and beyond everything that we've talked about here, is there anything else that's coming out with the tool that is a cool feature?
Yeah, the other really big thing that's getting released with the 3.0 version this December is the thing that we're calling the query builder. With that query builder, even more than a dashboard or report, we're giving customers a deeper granular access to their data from ERP or QMS. So previously with dashboards, a customer could build a grid or a chart or something like that using a collection of views that we've given them onto their data.
And these views are kind of simplified tables that they can pull fields from and build reporting from. But with the SQL query editor, customers are going to be able to directly write a query, a SQL, a read-only SQL query,
against their database and pull those data points right out of there. So if a customer needs even more granular access to their data, then even what the dashboards can provide, that's another feature that we're going to provide to them. That's awesome. That's huge. it's good to know that that's available
So that's all we've got for today.
So we said the Qt9 Business Intelligence Tool is slated for release in December 2025. For launch updates, for demos, pricing and licensing details, again, please reach out to your customer success rep, click on the link in the show notes to send in a request to our team here. And Riley, I just want to thank you for taking the time to join us today. Thanks so much. It was very helpful. I appreciate having me on. Absolutely. Absolutely. Our pleasure.
Share this
- QT9 QMS (7)
- Manufacturing (6)
- QMSR (3)
- FDA 21 CFR 820 (2)
- ISO 13485 (2)
- ISO 9001 (2)
- AS9100 (1)
- Aerospace & Defense (1)
- Analytics & Reporting (1)
- Business Intelligence (1)
- CAPA (1)
- CMMC (1)
- COPQ (1)
- Cannabis (1)
- Change Management (1)
- Continuous Improvement (1)
- Implementation (1)
- Inspections (1)
- QT9 BI Tool (1)
- Quality Culture (1)
- Software Validation (1)