Share this
Turn Data Into Decisions With the QT9 Business Intelligence Tool
by QT9 Software on November 18, 2025
Manufacturers and life sciences organizations are drowning in data but starving for insight. In fact, in manufacturing, about 80 percent of data goes unused, leaving performance gains on the table.
QT9 Business Intelligence (BI) Tool is designed to change that. And our latest version of the tool brings together QT9 QMS, QT9 ERP and other data sources in a single analytics workspace, enabling quality and operations leaders to forgo outdated spreadsheets in favor of dashboards that use real-time data.
An enhanced BI Tool version will be released this December, offering greater unification of QMS and ERP metrics, external data connections and a new query builder that gives power users direct SQL access to their data.
Our latest QT9 Q-Cast podcast episode gets the details from QT9 analyst, Riley Wise.
Contents
What is the QT9 Business Intelligence (BI) Tool?
Updates unify QMS and ERP analytics in a single tool
BI Tool updates enable external connections
New Query Builder for BI power users
Automated refresh for dashboards and live reports
From raw data to meaningful metrics on day one
What is the QT9 Business Intelligence (BI) Tool?
QT9 Business Intelligence is an analytics platform that can stand on its own or easily integrate with QT9 QMS,ERP and MRP software. It lets customers:
- Build custom dashboards and KPIs
- Run prebuilt reports across quality and operations
- Combine QMS, ERP and third-party data in one view
- Share dashboards across teams, with governed access
Out of the box, customers get prebuilt dashboards and reports so they can log in and start using analytics on day one.
Watch the latest Q-Cast on QT9 Business Intelligence 3.0
Updates unify QMS and ERP analytics in a single tool
Most organizations manage QMS and ERP analytics separately: one spreadsheet for supplier nonconformances, another for jobs and inventory, another for on-time delivery.
QT9 BI Tool breaks down those silos by making QMS and ERP data available in the same location, enabling greater cross-platform analytics in your dashboards.
Wise explains: “Instead of creating a siloed dashboard just on QMS audits or NCP records, now you can combine views with job and purchasing data from QT9 ERP.”
Some practical examples:
-
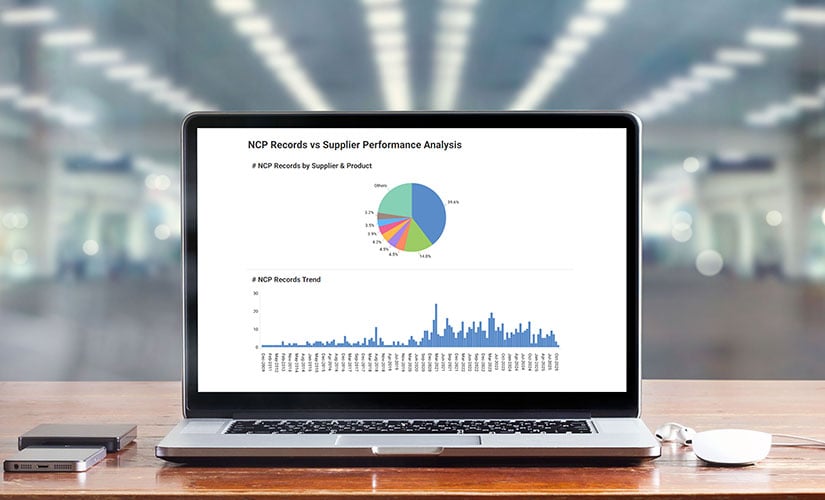
Supplier quality vs purchasing performance
Users can compare supplier nonconformance data from QT9 QMS with purchase order lines, delivery performance and material cost from QT9 ERP to see which suppliers drive the most defects and cost.
-
Aging and expired inventory dashboard
On the ERP side, a prebuilt “Aging and Expired Inventory” dashboard helps teams see how old stock is, what is expired and where to focus cleanup efforts.
-
Change management visibility
On the QMS side, a “Change Management” dashboard enables users to see which change controls are coming due, which approvers are outstanding and how records are distributed by status.
These dashboards give leaders a streamlined operational view across quality and operations in one system, rather than switching between software or maintaining a variety of spreadsheets.
BI Tool updates enable external connections
Instead of separate BI projects for each system, QT9 BI Tool can be the shared analytics layer for QMS, ERP and external sources. Wise outlines three additional data sources customers can pull into QT9 for advanced analytics:
- Excel files
Customers can upload structured Excel files as flat tables and use them in dashboards. That means teams can take a spreadsheet they already use and blend it with QMS or ERP data instead of re-creating it by hand. - MySQL databases
QT9 BI can connect to a MySQL database to query operational or financial data outside QT9. - RESTful API endpoints
Customers can connect any REST API that exposes data, such as CRM metrics from HubSpot or meeting data from tools like Fathom, and then report on that data alongside QT9 metrics.
New Query Builder for BI power users
One of the most exciting features of this BI Tool update is the Query Builder, a read-only SQL editor built into the tool.
Previously, dashboards were built from simplified data views provided by QT9. Customers could drag fields onto charts and tables, but could not directly query the underlying database.
With Query Builder, power users now can:
- Write read-only SQL queries against their QT9 QMS or ERP database
- Pull in the exact fields they need for complex scenarios
- Export data to Excel and share queries and query results with team members
For organizations with advanced analytics teams, this offers deeper, more granular control without leaving the QT9 environment.
Automated refresh for dashboards and live reports
Data freshness is a common BI challenge. Many tools depend on manual refresh steps or batch exports.
With the latest QT9 BI update users can set a refresh rate, for instance hourly or daily. The dashboard will automatically refresh according to user parameters. Reports pull live data each time they are run, so the result is a snapshot of current information without extra configuration.
This supports use cases like daily quality stand-ups, weekly operations meetings and management reviews where teams expect to see current metrics without rebuilding the views.
New BI Tool view-only portal
For users who only need to view dashboards and reports, QT9 has added a View Only option to the BI Tool configuration. This is ideal for teams on the shop floor or for dashboards displayed on TVs in production areas.
Reports and dashboards can be shared with specific users or teams, so each group sees only what is relevant. Sensitive data such as accounting dashboards can stay restricted to the right audience.
From raw data to meaningful metrics on day one
QT9 BI Tool offers many ways to turn raw data into an insightful dashboard that teams can use from day one.
1. Start with prebuilt dashboards and reports
When QT9 BI is enabled, customers immediately have:
- System default dashboards for QMS and ERP
- Standardized reports for common use cases, such as training delinquencies by department
For example, the Training Delinquencies by Department report shows which employees are overdue on training, how long they are overdue and which departments need attention. Larger organizations with thousands of training records can use this to stay on top of compliance without manual tracking.
2. White glove onboarding
Wise notes that many customers come to training with a specific module or process in mind, such as open nonconformances, aging CAPAs or department-level training status. The training team then helps turn that use case into a working dashboard.
When customers license the QT9 BI Tool, they automatically receive two training sessions that focus on:
- Teaching how the tool works
- Co-building first dashboards tailored to the customer’s modules, teams or processes
3. Copy and adapt system dashboards
Every prebuilt dashboard can be copied and edited. Customers can:
- Add new KPIs or charts
- See exactly how QT9 built the original dashboard
- Use system dashboards as templates for their own analytics
“The goal is for customers to see what can be done,” Riley explains, and then apply those patterns to their own modules and workflows.
With QT9 BI, customers can:
- Build a dashboard once with the KPIs and filters they need
- Reuse the same dashboard for different time periods, departments or sites
- Replace recurring exports, VLOOKUPs and manual reconciliations with live views
- Configure filters so teams can reuse a dashboard across departments or sites, switching context as needed.
That streamlined reporting aligns with survey findings that better data access can materially impact revenue and performance.
The new version of QT9 Business Intelligence is targeted for release in December 2025.
For launch updates, demos and pricing, QT9 customers can reach out directly to their customer success representative or visit the new QT9 BI web page to request a demo and learn more about its capabilities.
FAQs: QT9 Business Intelligence Tool
The QT9 Business Intelligence (BI) Tool is an integrated analytics solution that transforms real-time quality data into interactive dashboards, KPIs and automated reports. It helps teams visualize performance across QT9 QMS, ERP, MRP and other external sources, eliminating the need for external BI systems or manual data exports.
QT9 BI includes preconfigured dashboards such as Aging and Expired Inventory and Change Management, along with canned reports like training delinquencies by department. These are ready to use on day one and can be copied and tailored.
Yes. Customers can build dashboards from scratch or copy system dashboards and modify them. They can add KPIs, charts and filters for specific modules, departments, sites or timeframes.
The new version supports Excel uploads, MySQL databases and RESTful API connections. That means you can blend QT9 data with CRM data, meeting data or other operational sources.
Query Builder lets power users write read-only SQL queries directly against QT9 databases. User data can be used to create custom grids that they can export or shared with team members.
Each dashboard has its own refresh setting. Users can choose options like “always,” hourly or daily. Reports pull live data whenever they are run, so there is no separate refresh step.
QT9 BI uses concurrent licenses for full users and offers a separate, lower-cost View-Only Portal for users who only need to see dashboards and reports. Role-based permissions control who can administer, edit or view analytics.
Yes. QT9 BI is built to work with QT9 QMS and QT9 ERP, which are widely used in regulated industries including medical devices, pharmaceuticals and nutraceuticals. Customers can use it to monitor compliance-related KPIs like training status, change control cycle time and nonconformance trends.
Existing QT9 customers can contact their customer success representative. Prospective users can submit a demo request through the QT9 Business Intelligence page on the QT9 Software website.
Share this
- QT9 QMS (62)
- QT9 ERP (52)
- Manufacturing (26)
- Company News (13)
- Medical Devices (13)
- FDA Compliance (12)
- Pharmaceuticals (10)
- Inventory Management (8)
- Document Control (6)
- Life Sciences (6)
- MRP (6)
- QMSR (6)
- Analytics & Reporting (5)
- Aerospace & Defense (4)
- Audit Management (4)
- CAPA (4)
- ISO 9001 (4)
- Supplier Quality Management (4)
- Accounting (3)
- Bill of Materials (3)
- EU Compliance (3)
- Electronic Batch Records (EBR) (3)
- FDA 21 CFR 820 (3)
- Inspections (3)
- AS9100 (2)
- Change Control (2)
- EMS (2)
- Employee Training (2)
- Food & Beverage (2)
- ISO 13485 (2)
- ISO 14001 (2)
- Calibration Management (1)
- Cannabis (1)
- Change Management (1)
- Compliance (1)
- Continuous Improvement (1)
- Cosmetics (1)
- Customer Feedback (1)
- Cybersecurity (1)
- DHF/DMR/DHR (1)
- Defense (1)
- Design Controls (1)
- Digital Quality Transformation (1)
- FDA 21 CFR Part 11 (1)
- MoCRA (1)
- Quality Culture (1)
- Quality Events (1)
- Returns Management (1)
- Risk Management (1)
- SQF (1)
- Traceability (1)
- Training Management (1)
- June 2026 (8)
- May 2026 (8)
- April 2026 (9)
- March 2026 (6)
- February 2026 (8)
- January 2026 (8)
- December 2025 (6)
- November 2025 (8)
- October 2025 (7)
- September 2025 (8)
- August 2025 (8)
- July 2025 (6)
- June 2025 (7)
- May 2025 (5)
- April 2025 (2)
- March 2025 (4)
- February 2025 (4)
- January 2025 (6)
- December 2024 (4)
- November 2024 (3)
- October 2024 (5)
- September 2024 (3)
- August 2024 (3)
- July 2024 (3)
- June 2024 (5)
- May 2024 (2)
- April 2024 (3)
- March 2024 (2)
- February 2024 (5)
- January 2024 (1)