Share this

by QT9 Software on August 10, 2026
Poor quality is more than scrap and rework. In regulated manufacturing, it quietly drains capacity, adds compliance risk and obscures where margins are being lost.
Contents
How the cost of poor quality spreads across operations
How poor quality increases operational and sustainability costs
Why executives need better cost of poor quality data
How connected QMS and ERP systems help reduce COPQ
Making quality a measurable source of ROI with QT9 Software
How the cost of poor quality spreads across operations
In regulated environments, such as life sciences, medical devices, pharmaceuticals, biotech, aerospace and other controlled manufacturing, quality issues rarely stay on the shop floor. A single deviation can ripple into documentation, production scheduling, inventory planning, supplier management, audit preparation, customer commitments and regulatory exposure.
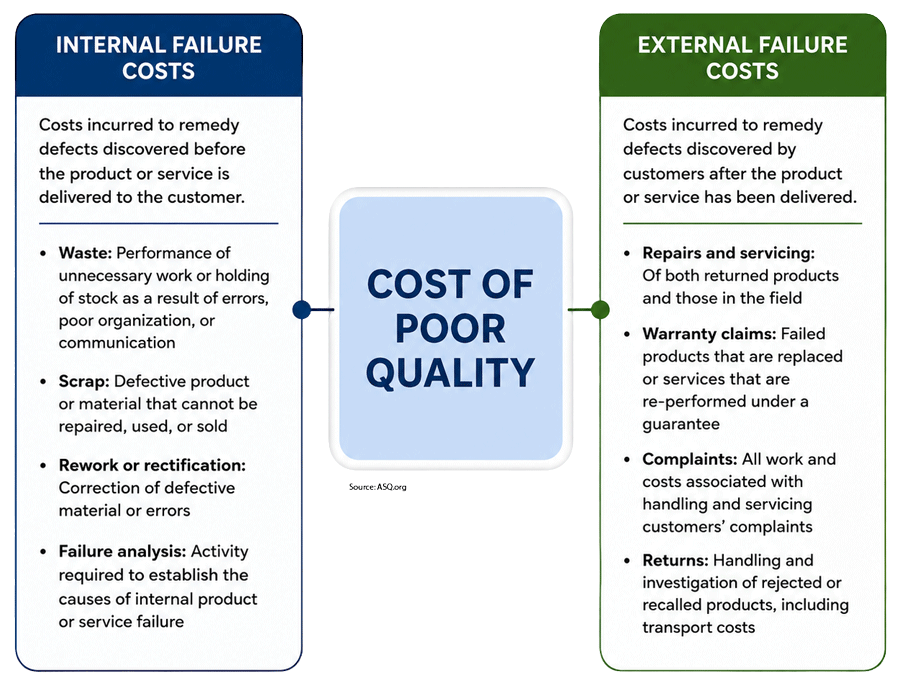
Properly calculating the Cost of Poor Quality (COPQ) gives manufacturers a way to see the full impact of preventable failures, inefficiencies and delays. It reframes quality from a necessary expense into a potential driver of measurable return when organizations understand where costs are accumulating and why.
What is included in COPQ?
Most manufacturers track visible problems, like scrap, rework, downtime, rejected materials and failed inspections. In regulated manufacturing, though, a large share of COPQ sits in everything that happens outside those events.
Teams spend significant time investigating deviations, gathering records, routing approvals, initiating CAPAs, reviewing documentation, communicating across departments and preparing evidence for audits. When information is scattered across multiple systems, this work takes longer, requires more manual effort and creates more opportunities for error. Delayed change management, training gaps and supplier variability compound these costs over time, even when formal quality requirements appear to be met.
How poor quality increases operational and sustainability costs
Hidden quality costs show up as operational drag. They divert time and capacity away from productive work, slowing output and customer response.
Uncertainty in process consistency or supplier performance often leads manufacturers to carry extra inventory as a buffer. While that may reduce the immediate risk of disruption, it ties up capital, increases storage costs and complicates traceability, expiration management and documentation control.
Poor quality also affects sustainability. It drives wasted materials and energy, additional transportation and repeated production runs. Administrative inefficiencies add to the impact when they result in duplicated effort and paper-heavy workflows. Reducing quality failures supports both profitability and environmental performance by cutting waste in materials, energy, labor and time.
Why executives need better cost of poor quality data
COPQ is difficult to evaluate when data is fragmented or limited. Scrap and rework metrics show part of the story, but they rarely capture the cost of delayed decisions, extended investigations, supplier issues, training gaps or slow product release driven by incomplete compliance records and pending approvals.
Connecting quality metrics to financial outcomes changes the executive conversation, giving leaders visibility into the cost of each nonconformance, deviation resolution times, recurring CAPAs, supplier quality impacts on production planning, and revenue delays caused by documentation bottlenecks. With real-time visibility across nonconformances, CAPAs, production data, supplier information and training records in a centralized system, teams can spot patterns earlier, intervene sooner and unlock quick wins by making investigations faster and root causes easier to address.
How connected QMS and ERP systems help reduce COPQ
Many persistent quality costs are amplified by disconnected systems. Quality data may live in one platform, production data in another, inventory and training records in separate tools. When these systems do not communicate, teams must manually reconstruct what happened each time an issue arises.
In regulated environments, this fragmentation is expensive: teams must understand which materials and batches were involved, which suppliers contributed, who performed the work, which documents were current and what corrective actions were followed. When that information is dispersed across systems, investigations slow and the risk of error increases.
By integrating QMS and ERP, quality data becomes part of a connected system instead of a standalone compliance record, linking directly to planning, inventory, production, supplier management and batch documentation. This gives manufacturers a clearer view of cause and effect across the production lifecycle and lets quality, operations, supply chain and finance operate from the same information rather than interpreting separate data sets.
In regulated industries, it is equally important that these connected systems are properly validated so the software managing quality and production performs consistently and reliably. Proper validation protects data integrity, supports audit readiness and reduces the risk of costly remediation.
Making quality a measurable source of ROI with QT9 Software
The future of quality management is a connected operating model where compliance, production and performance are managed together. In that environment, COPQ becomes a practical tool for identifying waste, prioritizing improvements and measuring the return on stronger processes and systems.
Manufacturers can begin by building a baseline around nonconformance costs, scrap and rework trends, deviation resolution times, audit preparation effort, supplier-related issues, training gaps and product release delays. Even imperfect data helps surface where hidden costs are concentrated and where change will have the greatest impact.
QT9 Software supports this connected approach with quality management and ERP software designed for regulated manufacturers. The solutions emphasize pre-validated, audit-ready software, scalability, end-to-end traceability and tight integration between quality and operations. These capabilities help centralize quality events, automate workflows, maintain training visibility, connect records across departments and accelerate access to audit-ready information. By connecting quality and operational data, manufacturers are better positioned to reduce avoidable waste, improve throughput, protect margins and make decisions based on real evidence.

ISO 9001:2026 - What Requires Action and What Does Not