Share this
by James Schloz on August 20, 2026
Defect rate, on-time delivery, lead time and cost remain important supplier performance metrics. They tell you whether suppliers met expectations and provide essential data for supplier reviews.
The only drawback is that manufacturers must remember that these metrics are considered lagging indicators. By the time data about a supplier’s growing defect rate or negative on-time delivery score comes to light, your organization may already be dealing with rejected material, production interruptions, corrective actions or customer risk.
For regulated manufacturers, a more impactful approach for monitoring supplier quality and risk is to pair traditional KPIs with leading supplier performance metrics that expose changes in consistency, response, corrective actions and risk before a serious failure develops. Following are 10 metrics worth watching.
Contents
What are supplier performance metrics?
How to measure supplier performance
How to build a supplier performance metrics scorecard
Ways to visualize supplier performance
Turn supplier performance data into early action with QT9
What are supplier performance metrics?
Supplier performance metrics measure whether suppliers are meeting requirements for five main areas: quality, delivery, responsiveness, corrective action and risk. Two of the most important metrics are supplier on-time delivery and incoming material quality.
ASCM identifies both among its essential supply-chain KPIs in its April 2025 guidance. See ASCM's supply chain KPI guidance.
These metrics provide a valuable performance baseline. They become even more useful when you analyze the factors underneath them.
For instance, manufacturers should look beyond this month's defect rate to whether the supplier’s inspection failures are accelerating. Instead of looking only at average lead time, look at whether lead-time variation is increasing. Instead of counting closed supplier corrective actions, determine whether the same nonconformance returned after closure.
Those are the types of measures that expose changes in supplier performance earlier. The following 10 metrics focus on early warning signals rather than lagging results.
How to measure supplier performance
1. Incoming Inspection Failure Trend
What it measures: Whether incoming materials are failing inspection more frequently over time.
Incoming material quality is already a recognized supply-chain KPI. ASCM's 2025 KPI guidance recommends examining incoming material quality by supplier or product category, including the proportion of faulty materials compared with acceptable materials.
The problem with reporting only the current failure rate is that it hides direction.
Consider a supplier whose inspection failure rate moves from:
2% → 2.5% → 3.1% → 4.2%
The latest figure might still fall within an organization's internally established threshold, but it’s the direction trend that deserves attention.
A useful supplier scorecard calculation is:
Incoming inspection failure rate = Failed incoming inspections ÷ Total incoming inspections × 100
Note that this is a management calculation rather than a universal industry formula. Organizations should define exactly what constitutes a failure and which inspections are included.
Why it provides an early warning: A sustained increase in incoming inspection failures shows declining material conformity sooner than a quarterly supplier rating would change enough to trigger escalation.
2. Repeat Supplier Nonconformance Rate
What it measures: How often the same supplier problem occurs again after it has been identified the first time.
Defect counts tell you how many problems occurred. Recurrence tells you whether the supplier is actually eliminating the causes. Manufacturers should track repeat nonconformances by supplier, product, failure mode, process or root-cause category.
Repeat nonconformance rate = Recurring supplier nonconformances ÷ Total supplier nonconformances × 100
Again, this is an internally defined management metric rather than a universal industry formula, so organizations should establish their own classification rules and thresholds.
Why it predicts problems: Recurrence signals that containment or corrective action has not controlled the underlying issue.
Corrective-action systems are specifically intended to investigate nonconformities, determine their cause, prevent recurrence and verify effectiveness. If the same supplier defect keeps returning, a good overall supplier score should not hide it.
3. Supplier Change Notification Frequency
What it measures: How often a supplier reports changes involving materials, processes, equipment, facilities, sub-tier suppliers, specifications or other controlled conditions.
The metric itself does not mean frequent changes are bad. The useful signal is whether changes are increasing, whether they affect critical components and whether required reviews are completed before implementation.
Why it matters: A rising volume of supplier changes increases the amount of quality and qualification activity your organization needs to undertake. For regulated manufacturers, an unreviewed or poorly controlled supplier change introduces a different type of exposure than overdue corrective actions.
4. Overdue Supplier Corrective Actions
What it measures: The percentage or number of supplier corrective actions that have passed their agreed completion dates.
Corrective-action closure speed alone is not proof of effectiveness. Some issues legitimately require extensive investigation, validation or monitoring. But growing overdue volume deserves attention.
A useful internal calculation:
Overdue supplier corrective-action rate = Overdue open actions ÷ Total open supplier corrective actions × 100
Also track aging. An action that is three days overdue represents a different level of exposure than one that has remained unresolved for six months.
Why it predicts problems: A growing corrective-action backlog shows that supplier quality problems are remaining unresolved. The signal becomes stronger when several measures deteriorate together: More nonconformances + more overdue actions + more recurrence
The combination deserves much more attention than any one metric viewed alone.
5. Corrective Action Effectiveness Rate
What it measures: Whether completed supplier corrective actions actually prevent the problem from returning.
A closed corrective action is not automatically an effective corrective action. Organizations therefore need to distinguish between action completed and action proven effective. An internal supplier scorecard might track the percentage of supplier corrective actions that pass effectiveness review without recurrence or reopening.
Why it provides an early warning: Repeated ineffective corrective actions suggest a supplier is treating symptoms rather than eliminating causes.
That information is much more useful than a dashboard showing that 95% or 100% of corrective actions have simply been marked "closed."
6. Lead-Time Variability
What it measures: How consistently a supplier performs around its expected lead time.
Average lead time is a useful, metric, but variation around that average often says more about risk.
Suppose two suppliers lead times both average 14 days:
-
Supplier A consistently delivers in 13–15 days.
-
Supplier B delivery ranges from 8–24 days.
Their averages look similar. Their impact on purchasing, inventory and production planning does not. Organizations can monitor variability using a statistical measure, such as range or standard deviation.
Why it predicts problems: Increasing variation often appears before the average becomes unacceptable. This would also makes production scheduling and inventory planning less reliable.
7. On-Time Delivery Trend
What it measures: Whether supplier delivery reliability is improving, stable or deteriorating.
On-time delivery remains one of the most useful top-level supplier performance metrics. ASCM's 2025 guidance describes on-time delivery in terms of shipments delivered on time compared with late shipments.
The familiar scorecard calculation is:
On-time delivery = On-time deliveries ÷ Total deliveries × 100
But the predictive value comes from showing trend, not just the latest result.
For example:
99% → 99% → 98% → 97% → 95%
A dashboard showing only "95% OTD" misses important information. A dashboard showing six months of deterioration tells a quality team that supplier reliability is moving in the wrong direction.
Why it provides an early warning: A supplier does not need to cross an internally defined failure threshold before the organization begins asking why delivery performance is deteriorating. Trend gives management that opportunity.
8. Supplier Audit Finding Recurrence and Closure
What it measures: Whether supplier audits repeatedly uncover the same weaknesses and whether findings remain unresolved.
Audit scores alone create an incomplete picture. Two suppliers might each receive a score of 90%, while one has minor isolated observations and the other has repeated findings in the same critical process.
Track findings by:
-
Severity
-
Process
-
Recurrence
-
Due date
-
Closure status
-
Effectiveness verification
Why it predicts problems: Repeated audit findings reveal weaknesses that have not been sustainably corrected. They also give quality teams an opportunity to investigate before that weakness produces a significant incoming material or product issue.
9. Supplier Responsiveness Trend
What it measures: How quickly suppliers respond to quality, purchasing and operational requests over time.
Instead of treating responsiveness as a subjective score of "good," "average" or "poor," quantify the events that matter.
Examples include:
-
Time to acknowledge a supplier corrective action
-
Time to confirm a purchase order
-
Time to respond to a documentation request
-
Time to address a specification question
-
Time to communicate a delivery issue
-
Time to respond to a change request
Why it predicts problems: A supplier that suddenly becomes harder to reach or slower to commit might be experiencing capacity, staffing, operational or management problems before those issues affect deliveries. Do not treat the metric as proof of a specific cause, treat it as a reason to investigate.
10. Supplier Risk and Capacity Status
What it measures: Whether a critical supplier remains capable of supporting future requirements.
Historical supplier performance does not tell you everything about future supply. Performance and risk are related, but they are not the same thing. A supplier might have excellent quality history, excellent on-time delivery and no open corrective actions but still represent significant exposure because it is the only qualified source for a critical component.
Risk-based supplier monitoring should, therefore, account for factors beyond historical KPI scores.
NIST's November 2024 supply-chain risk management report emphasizes identifying, assessing and mitigating supplier and supply-chain risks and improving organizational visibility into suppliers, products, services and their associated risks.
For a manufacturing supplier scorecard, documented risk factors might include:
-
Supplier criticality
-
Single-source dependency
-
Product or component criticality
-
Capacity constraints
-
Alternate manufacturing locations
-
Required certifications
-
Business-continuity controls
-
Geographic or logistical exposure
-
Significant unresolved audit or quality issues
Why it predicts problems: A supplier may have an excellent quality history while simultaneously becoming a serious continuity risk. The score should therefore show performance and exposure separately instead of assuming past performance equals future reliability.
Two top-tier metrics to keep
Predictive metrics should complement, not replace, the core supplier KPIs used throughout procurement and supply-chain management. Two KPIs deserve a permanent place in nearly every supplier performance metrics scorecard.
On-Time Delivery
Industry guidance continually lists on-time supplier performance and on-time delivery among its essential supply-chain measures.
Use OTD as the top-level result.
Then show:
OTD → OTD trend → lead-time variability → open delivery risks
Executives see the outcome and immediately understand whether the situation is improving or deteriorating.
Incoming Material Quality
ASCM also identifies incoming material quality as an essential supply-chain KP and recommends evaluating it by supplier, product category or faulty versus acceptable materials.
Use overall defect or acceptance performance as the outcome, then add inspection trends, recurring nonconformances, and corrective-action effectiveness to expose the underlying direction.
That creates a much more useful hierarchy:
Top-tier KPI → Trend → Cause → Corrective action → Risk
How to build a supplier performance metrics scorecard
A supplier scorecard should not become a wall of KPIs.
NIST recommends a balanced supplier scorecard with quantitative and qualitative measures, tailored by supplier and weighted according to business needs. It specifically emphasizes quality, risk, responsiveness and on-time delivery.
For regulated manufacturers, organize the scorecard into four categories:
|
Category |
KPI |
Early-Warning Measures |
|
Quality |
Incoming material quality |
Inspection failure trend, repeat nonconformances |
|
Delivery |
On-time delivery |
OTD trend, lead-time variability |
|
Corrective Action |
Open supplier quality issues |
Response time, overdue actions, effectiveness |
|
Risk |
Supplier risk status |
Criticality, concentration, continuity and capacity indicators |
Targets should reflect supplier criticality, part risk, contractual requirements, historical performance, regulatory requirements and your organization's risk tolerance.
A supplier producing a safety-critical medical-device component should not necessarily be scored the same way as a supplier providing low-risk indirect materials.
Ways to visualize supplier performance
Manufacturing leadership must be able to easily see where business exposure is increasing and what requires action. Supplier analytic dashboards should quickly show which suppliers or sourced product require attention and why. That means the dashboard should prioritize exceptions and trends over raw volume of information.
Start with a five indicators for each supplier:
-
Overall supplier status
-
Incoming quality: Current quality result plus direction of change
-
Current OTD plus recent trend
-
Open supplier corrective actions
-
Current supplier risk level
Then provide a trend view where, instead of displaying only current-period values, you make the trend available directly beside it..
Instead of:
OTD: 96%
show:
OTD: 96% ↓
The same approach works for:
-
Inspection failure rate
-
Nonconformance recurrence
-
Corrective-action aging
-
Audit findings
-
Lead-time variation
-
Supplier responsiveness
Finally, add an exceptions view showing the suppliers that require action. Executives should immediately see which critical suppliers are deteriorating, what metric triggered the concern and whether corrective action is underway. That is more useful than ranking hundreds of suppliers by a single composite score.
Turn supplier performance data into early action with QT9
Supplier performance metrics are more useful when they connect directly to the quality activities behind them. With QT9 QMS, we bring supplier evaluation, qualification, communication and performance monitoring into one quality management environment.
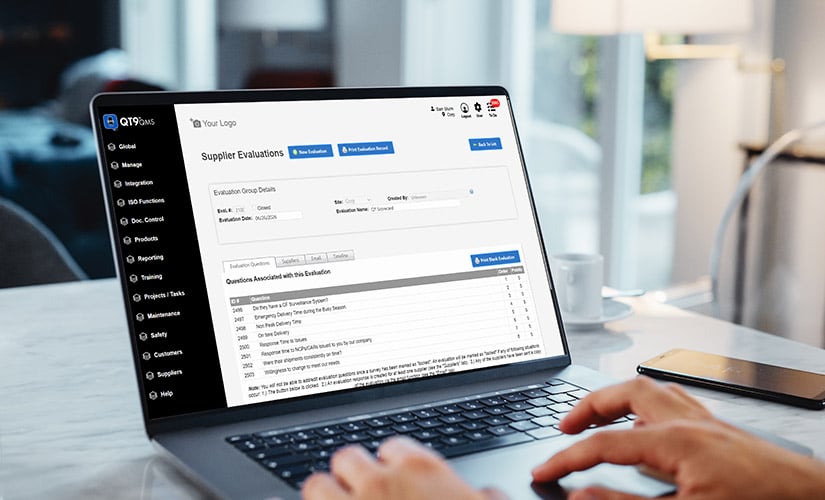
Our Supplier Evaluation Software lets you qualify, score and re-evaluate suppliers while maintaining evaluation histories, reports and supporting records. Our Supplier Survey Software helps you collect qualification, compliance and documentation information directly from suppliers. And our Supplier Web Portal gives suppliers a secure way to complete surveys, review evaluations, exchange documents and respond to assigned quality tasks.
QT9 QMS also connects supplier management with broader quality processes, including corrective actions, nonconformances, document control and risk management. That gives your team the context behind the scorecard, from the first warning sign through investigation, corrective action and follow-up.
Instead of simply documenting how a supplier performed, QT9 QMS gives you the tools to identify changing risk, respond faster and drive supplier improvement.
See how QT9 QMS helps you evaluate suppliers, track quality issues and turn supplier data into faster, more informed action.


Five Best Supplier Management Software QMS Platforms, 2026